The Infrastructure Engineering Lifecycle – How to Build and Sustain a Top Quartile Infrastructure

There are over 5,000 books on applications development methods on Amazon. There are dozens of industry and government standards that map out the methodologies for application development. And for IT operations and IT production processes like problem and change management, IT Service Management and ITIL standards provide excellent guidance and structure. Yet for the infrastructure systems on which the applications rely on fully, there is scarcely a publication which outlines the approaches organizations should use to build and sustain a robust infrastructure. ITIL ventures slightly in this area but really just re-defines a waterfall application project cycle in infrastructure terms. During many years of building, re-building, and sustaining top quartile infrastructure I have developed a life cycle methodology for infrastructure or ‘Infrastructure Engineering Life Cycle’ (IELC).

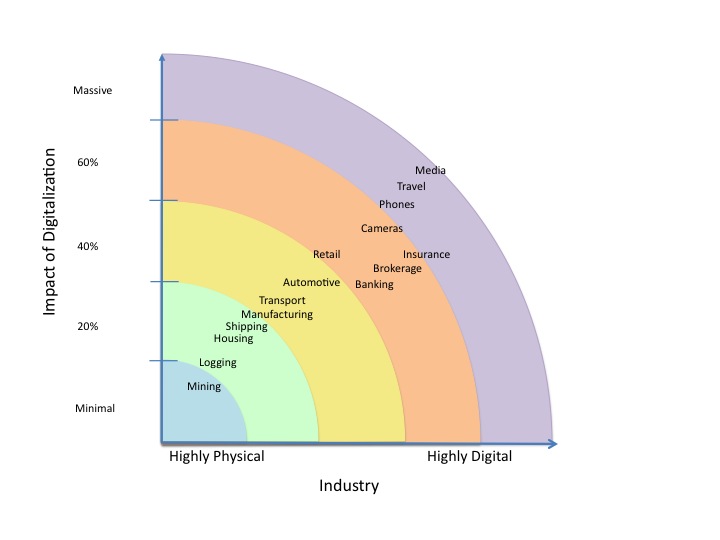
The importance of infrastructure should not be overlooked in our digital age. Not only have customer expectations increased for services where they expect ‘always on’ web sites and transaction capabilities, but they also require quick response and seamless integration across offerings. Certainly the software is critical to provide the functionality, but none of these services can be reliably and securely provided without a well-built infrastructure underpinning all of the applications. A top quartile infrastructure delivers outstanding reliability (on the order of 99.9% or better availability), zippy performance, excellent unit costs, all with robust security and resiliency.

Often enterprises make the mistake of addressing infrastructure only when things break, and they only fix or invest enough to get things back running instead of re-building correctly a modern plant. It is unfortunate because not only will they likely experience further outages and service impacts but also their full infrastructure costs are likely to be higher for their dated, dysfunctional plant than for an updated, modern plant. Unlike most assets, I have found that a modern, well-designed IT infrastructure is cheaper to run than a poorly maintained plant that has various obsolete or poorly configured elements. Remember that every new generation of equipment can basically do twice as much s the previous so  you have fewer components, less maintenance, less administration, less things that can go wrong. In addition, a modern plant also boosts time to market for application projects and reduces significantly the portion of time spent on fixing things by both infrastructure and application engineers.

So, given the critical nature of well-run technology infrastructure in the world of digitalization, how do enterprises and CIOs build and maintain a modern plant with outstanding fit and finish? It is not just about buying lots of new equipment, or counting on a single vendor or cloud provider to take care of all the integration or services. Nearly all major enterprise have a legacy of systems that result in complexity and complicate the ability to deliver reliable services or keep pace with new capabilities. These complexities can rarely be handled by a systems integrator or single service provider. Further, a complete re-build of the infrastructure often requires major capital investment and and can put the availability even further at risk. The best course is usually then is not to go ‘all-in’ where you launch a complete re-build or hand over the keys to a sole outsourcer, but instead to take a ‘spiral optimization’ approach which addresses fundamentals and burning issues first, and then uses the newly acquired capabilities to advance and address more complex or less pressing remaining issues.

A repeated, closed cycle approach (‘spiral optimization’) is our management approach. This management approach is coupled with an Infrastructure Engineering Lifecycle (IELC) methodology to build top quartile infrastructure. For the first cycle of the infrastructure rebuild, it is important to address the biggest issues. Front and center,  the entire infrastructure team must focus on quality. Poorly designed or built infrastructure becomes a blackhole of engineering time as rework demands grow with each failure or application built upon a teetering platform. And while it must also be understood that a everything cannot be fixed at once, those things that are undertaken, must be done with quality. This includes documenting the systems and getting them correctly into the asset management database. And it includes coming up with a standard design or service offering if none exists. Having 5000 servers must be viewed as a large expense requiring great care and feeding — and the only thing worse is having 5000 custom servers because your IT team did not take the time to define the standard, keep it up to date, and maintain and patch it consistently. 5000 custom servers are a massive expense that likely cannot be effectively and efficiently maintained or secured by any team. There is no cheaper time than the present moment to begin standardizing and fixing the mess by requiring that the next server built or significantly updated be done such that it becomes the new standard. Don’t start this effort though until you have the engineering capacity to do it. A standard design done by lousy engineers is not worth the investment. So, as an IT leader, while you are insisting on quality, ensure you have adequate talent to engineer your new standards. If you do not have it on board, leverage top practitioners in the industry to help your team create the new designs.

In addition to quality and starting to do things right, there are several fundamental practices that must be implemented. Your infrastructure engineering work should be guided by the infrastructure engineering lifecycle – which is a methodology and set of practices that ensure high quality platforms that are effective, efficient, and sustainable.

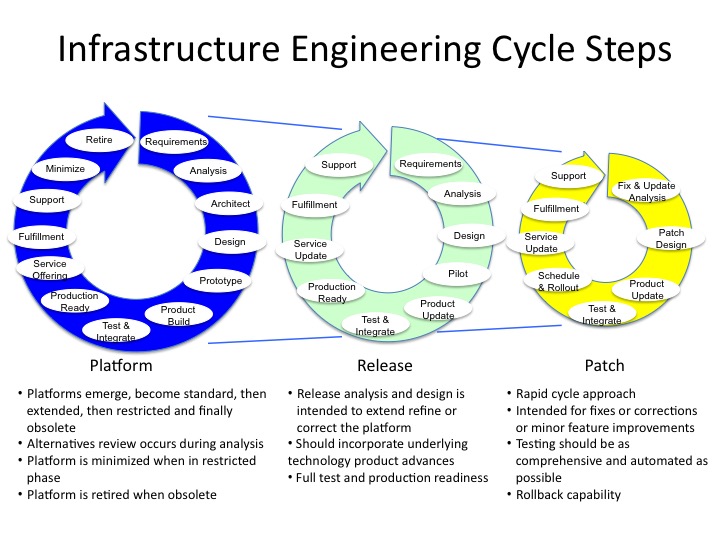
The IELC covers all phases of infrastructure platforms – from an emerging platform to a standard to declining and obsolete platforms. Importantly, the IELC is comprised of three cycles of activity that recognize that infrastructure requires constant grooming and patching where inputs come typically from external parties, and, all the while, technology advances regularly occur such that over 3 to 10 years nearly every hardware platform becomes obsolete and should and must be replaced. The three cycles of activity are:

  • Platform – This is the foundational lifecycle activity where hardware and utility software is defined, designed and integrated into a platform to perform a particular service. Generally, for medium and large companies, this is  a 3 to 5 year lifecycle. A few examples could be a server platform, storage platform or an email platform.
  • Release – Once a platform is initial designed and implemented, then organizations should expect to refresh the platform on a regular basis to incorporate major underlying product or technology enhancements, address significant design flaws or gaps, and improve operational performance and reliability. Release should be planned for 3 to 12 month intervals over the life of the platform (which is usually 3 to 5 years).
  • Patch – A patch should also be employed where on a regular and routine basis, minor upgrades (both fixes and enhancements) are applied. The patch cycle should synchronize with both the underlying patch cycle of the OEM (Original Equipment Manufacturer) for the product and with the security and production requirements of the organization. Usually, patch cycles are used to incorporate security fixes and significant production defect fixes issued by the OEM. Typical patch cycles can be weekly to every 6 months.

Below is a diagram that represents the three infrastructure engineering life cycles and the general parameters of the cycles.

Infrastructure Engineering Cycles

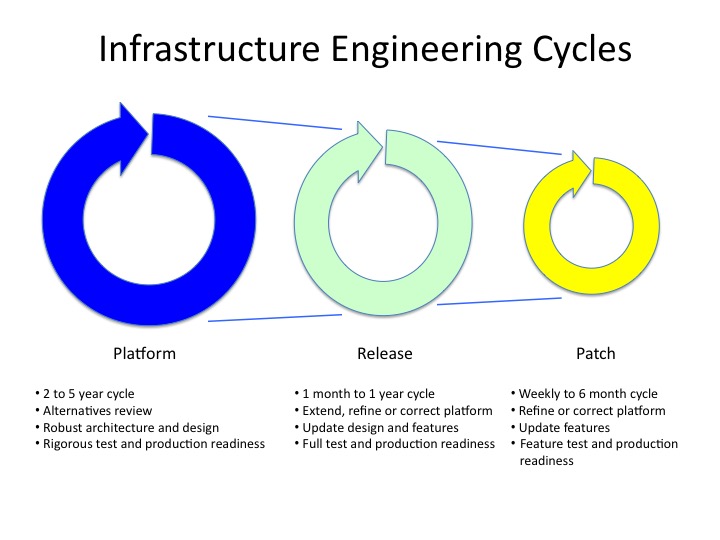
In subsequent posts, I will further detail key steps and practices within the cycles as well as provide templates that I have found to be effective for infrastructure teams.  As a preview, here is the diagram of the cycles with their activities and attributes.

IELC Preview
IELC Preview

What key practices or techniques have you used for your infrastructure teams to enable them to achieve success? I look forward to you thoughts and comments.

Best, Jim Ditmore


The Recent Quarter Results Confirm Tech Industry Trends

Some surprising and not so surprising results for the tech industry this past quarter (2Q15) confirm both longer term industry trends and also high volatility for mismatches in expectations and performance.

First, Apple delivered strong growth in revenue and profits again (38% growth in profits to $10.8B), and yet, because it was slightly below expectations, lost $60 Billion in value. While Apple sold a record 47.5 million iPhones and saw Mac sales of 4.8 million units (up 9%), investors were apparently disappointed in both the number of iPhones sold and the lack of clear information on the iWatch. Even though it appears the iWatch is more successful at this point in the sales cycle than the iPad or iPhone, investors were apparently expecting a leadoff home run and sent the stock down 7% on the results.

And the reverse occurred for both Google and Amazon. Google delivered solid growth with 11% increase in revenue to $17.7B with net income of $3.9B which sent shares up 12%. Investors were surprised with the breadth of growth, particularly in mobile, and that managers showed some cost control. Amazon actually delivered some profit, $214M on revenue of $29.33B, and showed continued robust growth of 15%. Investors sent Amazon’s stock up on the profit results, a rarity given Amazon’s typical long term vision focus and  willingness to spend for reach and scale even in areas well beyond its core.

What the quarterly results also reveal is that the tech platform companies (Amazon, Apple, Google) are continuing to be viewed as dominant but investors are uneasy about the long term stability of their platforms and thus have a quick trigger finger if they see any cracks in their future dominance. So, with Apple’s potential over-reliance on the iPhone, when there are fewer shipments than expected, or there is not clear evidence of a new platform extension (e.g. iWatch) then investors react sharply. On the reverse, when Google appears to be overcoming the mobile threat to its core search platform, it is well-rewarded by investors.

What do the quarter’s results say about the tech product companies? Unless they have strong portfolio of winning products, it appears they will continue to struggle to regain form. IBM, AMD, HP and others all posted disappointing results as they grapple with the technology revolutions in each of their industry sectors. AMD saw a 35% loss in revenue, dipping below $1B in quarterly revenue for the first time in years to $942M with a loss of $181M. Of course, the slow to declining PC sales worldwide is the primary cause and only console sales were healthy for AMD. Expect further difficult quarters as AMD adapts to the changing component industry (driven by impacts from the platform companies). HP continues a listless journey, its 2nd quarter reflecting a 7% slide in revenue from $27.3B to $25.5B, a 50% drop in operating margin, and a 10% drop in PC market shipments. While HP will split into two entities in November later this year which has some analysts upbeat, prospects look tough across all product segments with slow or declining growth except possibly enterprise software and 3D printing. IBM had mixed results, with better than expected profit on $20.81B in sales, yet saw continued revenue decline, which left investors nervous, sending the stock down. IBM did see strong growth in cloud services and analytics, but lackluster products and results in other core segments (e.g., hardware) which make up the vast bulk of IBM revenue yielded disappointing revenue and profit showings. IBM recently sold off its low end server business as it views that sector becoming increasingly commoditized. Yet, IBM will continue to find that selling services when you have limited ‘winning’ products is a tough lower margin business. And cloud services are far lower margin business than its traditional hardware business – and one where Amazon and Google are first-comers with volume edges. IBM can certainly leverage its enterprise relationships and experience, but that is far easier to do when you have products that provide real advantage to the customer. Other than analytics (Watson) and some software areas, IBM lacks these winning products, having neglected their product pipeline (instead focusing on services) for many years. While the alliance with Apple provides some possibility of developing modern, vertical industry applications that will be compelling, there is far more IBM must do to get back on track and part of that innovation must be in hardware.

EMC and Oracle are the exceptional large technology product companies that have been able to navigate the turbulent waters of their industry the past few years. Oracle did have weaker results this quarter, primarily due to currency fluctuations but also slowing software sales. Only EMC beat expectations and had new products overcome slowing demand for core areas.  Winning products for EMC like VMware and Pivotal as well as high demand for services and products in its information security division (RSA) and analytics more than overcame issues in the core storage division (which showed some recovery from 1Q). One could argue that with the VMWare franchise and leading engineered systems, EMC has established the strongest cloud platform, thus it has a more assured place with growth and margin in this rapidly changing sector.

The bottom line? Product companies will continue to struggle with revenue growth and margin pressure as technology advances undercut volumes and platform companies offer lower cost alternatives (e.g. public cloud options instead of proprietary server hardware and services, or smartphones instead of PCs) Unless technology product companies stay on the leading edge of innovating (or acquiring) compelling products, generating additional high margin revenues through services or software will be tough sledding. As we have mentioned here before, digitalization and the emergence of platform companies will result in more casualties in product companies – both in the tech space and outside it.

And of course, there is Microsoft. Microsoft is in a unique spot where it still has a strong productivity platform (e.g. Office, Exchange) but a diminishing OS platform. And with only low margin business that are growing rapidly (e.g. cloud), the road back to dominance looks very tough. Further, their forays into other tech sectors have been middling at best and disastrous at worst. The second quarter results included an $8B write down of the Nokia acquisition, which was made two years ago. The ‘devices and services’ strategy has shown to be a ‘phenomenal error’ by some accounts. PC sales continue to decline, and Microsoft was unable to effectively crack the smartphone market. The past quarter revealed declining revenue volume for phones even with 10% more volume as the only market segment MS gained traction was phone models at lower cost points. And it is hard to see that Samsung or other handset makers will add Windows OS to their product mix. Further, traditional Windows OS revenue (from OEMs) dropped 22%. The bright spots for MS were gaming (Xbox) and of course enterprise software and cloud services. There remain major concerns for the enterprise area where the rapidly growing cloud services has far lower margin than their traditional software business. Microsoft should continue to worry that increasing import of dominance in the consumer space often translates later into winning business space – thus,  the Google and Apple productivity platforms could be the long term trojan horses that blow up the enterprise cash cow for Microsoft. Microsoft may lose the war by trying to maintain its OS platform by limiting the reach of its productivity platform to consumers on their device of choice. Already, Google and Apple have changed the game by offering such software on the platforms for free, with free upgrades. Some assessments already show Microsoft lagging in feature without even considering its far higher cost. Windows 10 should be a solid hit for Microsoft, reversing some of the ground lost with Windows 8, but it will not dent the momentum of the Apple and Android platforms – especially when Microsoft introduces such new ways to monetize as the formerly free Solitaire’s lengthy advertisements or $9.99 annual subscription fee. They continue to misread the consumer market. Despite these continual missteps, or as recently called out in a New York Times article, their ‘feet of clay’, Microsoft has a strong enterprise business, a well-positioned productivity platform, and plenty of money. Can they figure out how to win in the consumer world while growing their productivity ecosystem with compelling extensions?

There remain multiple gaps that Microsoft, IBM, HP or even Oracle could exploit to win the next platform or obtain strong enterprise market share. While Apple and Android are pursuing the future car and the home platforms, the internet of things is still an open race. And there is opportunity given that most of the gazillion apps in the Android and Apple space are games or other rudimentary (1st generation) apps oriented for consumers. But there could be tremendous demand for myriad vertical industry applications that can easily link to a company’s legacy systems. IBM has started down this road with Apple, but plenty of opportunity remains for enterprise software players to truly leverage the dominant platforms for their own gain. Let’s hope the tech product companies can rekindle their growth by bringing out great products again.

Best, Jim Ditmore

The Key Growth Constraints on Your Business

We have seen the accelerating impact of technology on a wide variety of industries in the past decade. We have witnessed the impact of internet shopping on retail industries, and seen the impact of digital content and downloads on the full spectrum of traditional media companies across books and newspapers as well as movies and games. Traditional enterprises are struggling to anticipate and stay abreast of the advances and changes. Even in those industries far away from the digital world, where they seem very physical, it is critical to leverage ‘smart’ technologies to improve output and products.

Let’s take logging and sawmills as an example. Certainly there have been physical advances from improved hydraulic systems to better synthetic ropes, but playing an increasingly prominent role is the use of digital technology to assist operators to drive complex integrated machines to optimize the entire logging and sawing process. The latest  purpose-built forestry machines operate at the roadside or nearby off-road cutting logs from whole trees combining steps and eliminating manual labor. These integrated machines are guided on-board computers and electronic controls. This enables the operator to optimize log products which are machine cut by skillfully delimbing and “bucking” the whole trees into the best log lengths and loading them onto trucks. Subsequently, the logs are take to modern sawmills, where new scanning technologies and computers analyze each log and determine how to optimize the dimensional lumber cut from each log. Not only does this dramatically reduce manual labor and waste, but it improves safety and increases log product value by 20 or 30% from previous methods. And it is not just digital machinery leveraging computers to analyze and cut, but it is also mobile apps with mapping and image analysis so better decisions are made when and where to log in the field. When digitalization is revolutionizing even ‘physical’ industries like logging and sawmills, it is clear that the pace and potential to disrupt industries by applying information technology has increased dramatically. Below is a chart that represents the pace of disruption or ‘gain’ possible by digitalization over the mid-term horizon (7 to 10 years).

Slide1

It is clear that digitalization has dramatically changed the travel and media industries already. Digital disruption has been moving down into other industries as either their components move from physical to digital (e.g., cameras, film) or industry leaders apply digital techniques to take advantage (e.g., Amazon, Ameritrade, Uber). Unfortunately, many companies do not have in place the key components necessary to apply and leverage technology to digitalize in rapid or disruptive ways. The two most important ingredients to successfully digitalize are software development capacity and business process engineering skill. Even for large companies with sizable IT budgets there are typically major constraints on both software development and business process engineering. And ample quantities of both are required for significant and rapid progress in digitalization.

Starting with software development, common constraints on this capability are:

  • a large proportion of legacy systems that consume an oversize portion of resources to maintain them
  • inadequate development toolsets and test environments
  • overworked teams with a focus on schedule delivery
  • problematic architectures that limit digital interfaces and delivery speed
  • software projects that are heavily oriented to incremental product improvement versus disruptive customer-focused efforts

And even if there are adequate resources, there must be a persistent corporate focus on the discipline, productivity and speed needed for breakout efforts.

Perhaps even more lacking are the necessary business process engineering in many companies.  Here the issue is often not capacity or productivity but inadequate skill and improper focus. Most corporate investment agendas are controlled by ‘product’ teams whose primary focus is on incrementally improving their product’s features and capabilities rather than end to end service or process views that truly impact the customer. Further, process engineering skills are not a hallmark of service industry product teams. Most senior product leaders ‘grew up’ in a product focused environment, and unless they have a manufacturing background, usually do not have process improvement experience or knowledge. Typically, product team expertise lies primarily in the current product and its previous generations and not in the end-to-end process supporting the actual product. Too often the focus is on a next quarter product release with incremental features as opposed to fully reworking the customer interface from the customer’s point of view and reworking end-to-end the supporting business process to take full advantage of digitalization and new customer interfaces. There is far too much product tinkering versus customer experience design and business process engineering. Yet, the end-to-end process is actually what drives the digital customer experience versus the product features. Service firms that excel at the customer experience utilize the end-to-end process design from the customer viewpoint while taking full advantage of the digital opportunities. This yields a far better customer experience that is relatively seamless and easy. Further, the design normally incorporates a comprehensive interface approach that empowers each of the customer interaction points with the required knowledge about the customer and their next step. The end result is a compelling digital platform that enables them to win in the market.

As an IT leader certainly you must identify and sponsor the key digitalization projects for your company, but you must also build and develop the two critical capabilities to sustain digitalization. It is paramount that you build a software development factory that leverages modern methods on top of discipline and maturity so you have predictable and high quality software deliverables. And ensure you are building on an architecture that is both flexible and scalable so precious effort is not wasted on arcane internal interfaces or siloed features that must be replicated across your estate.

Work with your business partners to establish continuous process improvement and process engineering as desired and highly valued skills in both IT and the business team. Establish customer experience and user experience design as important competencies for product managers. Then take the most critical processes serving customers and revisit them from an end-to-end process view and a customer view. Use the data and analysis to drive the better holistic process and customer experience decisions, and you will develop far more powerful digital products and services.

Where is your team or your company on the digital journey? Do you have an abundance of software development or business process engineering skills and resources? Please share your perspective and experience in these key areas in our digital age.

Best, Jim Ditmore


IT Resolutions for 2015

While there is still one bowl game left to be played and confetti to clean up, 2014 is now done and leaves a mixed IT legacy.  After 2013’s issues with the NSA leaks, the Healthcare.gov mishaps, and the 40 million credit identities stolen from Target, 2014 did not turn out much better on security and availability. Home Depot, eBay, JPMC all had major incidents in the ‘year of the hacks‘. Add to that the celebrity photo leaks from the Apple hacks. Add to that of course the Sony uber-hack and their playstation service failure at Christmas. All in all, 2014 was quite a dismal year for IT security. On the positive side, we saw continued advances in smart technology, from phones to cars. Robots and drones are seeing major reductions in price while leapfrogging in usability and capability. So, technology’s potential seems brighter than ever, yet we still underachieve in our ability to prevent its mis-use. Now 2015 is upon us and I have compiled some IT resolutions that should contribute to greater success for IT shops in the coming year!

The first IT resolution is …. security, security, security. While corporate IT security has improved in the past several years, we are still well behind the hackers. The many breaches of 2014 demonstrate these shortcomings. Security is one of the fastest growing portions of IT (the number 2 focus item behind data analytics), but much more needs to be done though most of the crucial work is just basic, diligent execution of proper security practices. Many of the breaches took advantage of well-known vulnerabilities either at the company breached or one of its suppliers. For example, lack of current server patching was a frequent primary root cause on hacks in 2014.  And given the major economic hits of the Sony and Target breaches, these events are no longer speed bumps but instead threaten a company’s reputation and viability. Make the case now to your senior business management to double down your information security investment and not show up on the 2015 list of hacks. Not sure where to start?  Here’s a good checklist on security best practices that is still current and if fully applied would have prevented the majority of the public breaches in 2014.

Next is to explore and begin to leverage real-time decisioning. It’s more than big data — it is where you use all the information about the customer and trends to make the best decision for them (and your company) while they are transacting. It is taking the logic for ‘recommendations of what other people bought’ and applying data analytics to many kinds of business rules and choices. For example, use all the data and hidden patterns to better and more easily qualify a customer for a home loan — rather than asking them for a surfeit of documents and proofs. And offer them optimal pricing on the loan most suited for them — again determined by the data analytics. In the end, business policies will move from being almost static where changes occurs slowly, to where business policies are determined in real-time, by the data patterns. It is critical in almost every industry to understand and begin mastery of this technology.

Be on the front edge of the flash revolution in the enterprise. 2015 will be the year of flash. Already many IT shops are using hybrid flash disk technologies. With the many offerings on the market and 2nd generation releases by mainstream storage vendors like EMC, IT shops should look to leverage flash for their most performance-bound workloads. The performance improvements with flash can be remarkable. And the 90% savings on environmentals in your data center is icing on the cake. Flash, factoring in de-duplication, is comparable in cost to disk storage today. By late 2015, it could be significantly less.

If you haven’t already, go mobile, from the ground up. Mobile is the primary way most consumers interface with companies today. And with better phones and data networks, this will only increase. But don’t rely on a ‘mobilized’ version of your internet site. Make sure you tuning your customer interface for their mode of interaction. Nothing is more cumbersome to a consumer than trying to enter data from a phone into an internet form designed for PC. Yes, its doable, but nowhere near the experience you can deliver with a native app. Go mobile, go native.

Bring new talent into the IT labor force. By 2020, the Bureau of Labor Statistics estimates there will be another 1.4 million IT jobs in the US — and not nearly enough computer science graduates to fill them. Companies big and small should be looking to hire both new graduates in the field AND encourage more to look to computers for their career. In the 1970s and 1980s, before there were formal computer science programs at universities, many outstanding computer scientists received their degrees in music, biology, languages, or teaching. We need another wave of converts for us to have the skilled teams required for the demands of the next decade. As IT leaders, let’s make sure we contribute to our field and help bring along the next generation.

What are your 2015 IT resolutions? Let us know what should be on the list!

Best, and have a great New Year!

Jim


Improving Vendor Performance

As we discussed in our previous post on the inefficient technology marketplace, the typical IT shop spends 60% or more of its budget on external vendors – buying hardware, software, and services. Often, once the contract has been negotiated, signed, and initial deliveries commence, attentions drift elsewhere. There are, of course, plenty of other fires to put out. But maintaining an ongoing, fact-based focus on your key vendors can result in significant service improvement and corresponding value to your firm. This ongoing fact-based focus is proper vendor management.

Proper vendor management is the right complement to a robust, competitive technology acquisition process. For most IT shops, your top 20 or 30 vendors account for about 80% of your spend. And once you have achieved outstanding pricing and terms through a robust procurement process, you should ensure you have effective vendor management practices in place that result in sustained strong performance and value by your vendors.

Perhaps the best vendor management programs are those run by manufacturing firms. Firms such as GE, Ford, and Honda have large dedicated supplier teams that work closely with their suppliers on a continual basis on all aspects of service delivery. Not only do the supplier teams routinely review delivery timing,  quality, and price, but they also work closely with their suppliers to help them improve their processes and capabilities as well as identify issues within their own firm that impact supplier price, quality and delivery. The work is data-driven and leverages heavily process improvement methodologies like LEAN. For the average IT shop in services or retail, a full blown manufacturing program may be overkill, but by implementing a modest but effective vendor management program you can spur 5 to 15% improvements in performance and value which accumulate to considerable benefits over time.

The first step to implementing a vendor management program is to segment your vendor portfolio. You should focus on your most important suppliers (by spend or critical service). Focus on the top 10 to 30 suppliers and segment them into the appropriate categories. It is important to group like vendors together (e.g, telecommunications suppliers or server suppliers). Then, if not already in place, assign executive sponsors from your company’s management team to each vendor. They will be the key contact for the vendor (not the sole contact but instead the escalation and coordination point for all spend with this vendor) and will pair up with the procurement team’s category lead to ensure appropriate and optimal spend and performance for this vendor. Ensure both sides (your management and the vendor know the expectations for suppliers (and what they should expect of your firm). Now you are ready to implement a vendor management program for each of these vendors.

So what are the key elements of an effective vendor management program? First and foremost, there should be three levels of vendor management:

  • regular operational service management meetings
  • quarterly technical management sessions, and
  • executive sessions every six or twelve months.

The regular operational service management meetings – which occur at the line management level – ensure that regular service or product deliveries are occurring smoothly, issues are noted, and teams conduct joint working discussions and efforts to improve performance. At the quarterly management sessions, performance against contractual SLAs is reviewed as well as progress against outstanding and jointly agreed actions. The actions should address issues that are noted at the operational level to improve performance. At the nest level, the executive sessions will include a comprehensive performance review for the past 6 or 12 months as well as a survey completed by and for each firm.  (The survey data to be collected will vary of course by the product or service being delivered.) Generally, you should measure along the following categories:

  • product or service delivery (on time, on quality)
  • service performance (on quality, identified issues)
  • support (time to resolve issues, effectiveness of support)
  • billing (accuracy, clarity of invoice, etc)
  • contractual (flexibility, rating of terms and conditions, ease of updates, extensions or modifications)
  • risk (access management, proper handling of data, etc)
  • partnership (willingness to identify and resolve issues, willingness to go above and beyond, how well the vendor understand your business and your goals)
  • innovation (track record of bringing ideas and opportunities for cost improvement or new revenues or product features )

Some of the data (e.g. service performance) will be  summarized from operational data collected weekly or monthly as part of the ongoing operational service management activities. The operational data is supplemented by additional data and assessments captured from participants and stakeholders from both firms. It is important that the data collected be as objective as possible – so ratings that are high or low should be backed up with specific examples or issues. The data is then collated and filtered for presentation to a joint session of senior management representing their firms. The focus of the executive session is straightforward: to review how both teams are performing and to identify the actions that can enable the relationship to be more successful for both parties. The usual effect of a well-prepared assessment with data-driven findings is strong commitment and a re-doubling of effort to ensure improved performance.

Vendors rarely get clear, objective feedback from customers, and if your firm provides such valuable information, you will often be the first to reap the rewards. And by investing your time and effort into a constructive report, you will often gain an executive partner at your vendor willing to go the extra mile for your firm when needed. Lastly, the open dialogue will also identify areas and issues within your team and processes, such as poor specifications or cumbersome ordering processes that can easily be improved and yield efficiencies for both sides.

It is also worthwhile to use this supplier scorecard to rate the vendor against other similar suppliers. For example, you can show there total score in all categories against other vendors in an an anonymized fashion (e.g., Vendor A, Vendor B, etc) where they can see their score but can also see other vendors doing better and worse. Such a position often brings out the competitive nature of any group, also resulting in improved performance in the future.

Given the investment of time and energy by your team, the vendor management program should be focused on your top suppliers. Generally, this is the top 10 to 30 vendors depending on your IT spend. The next tier of vendors (31 through 50 or 75) should get an annual or biannual review and risk assessment but not the regular operational meetings or assessments and management assessment unless the performance is below par. Remediation of such a vendor’s performance can often be turned around by applying such a program.

Another valuable practice, once your program is established and is yielding constructive results, is to establish a vendor awards program. With the objective and thoughtful perspective of your vendors, you can then establish awards for your top vendors – vendor of the year, vendor partner of the year, most improved vendor, most innovative, etc. Perhaps invite the senior management of the vendor’s receiving awards to attends and awards dinner, along with your firm’s senior management to give the awards, will further spur both those who win the awards as well as those who don’t. Those who win will pay attention to your every request, those who don’t will have their senior management focused on winning the award for next year. The end result, from the weekly operational meetings, to the regular management sessions, and the annual gala, is that vendor management positively impacts your significant vendor relationships and enables you to drive greater value from your spend.

Of course, the vendor management process outlined here is a subset of the procurement lifecycle applied to technology. It complements the technology acquisition process and enables you to repairs or improve and sustain vendor performance and quality levels for a significant and valuable gain for your company.

It would be great to hear from your experience with leveraging vendor management.

Best, Jim Ditmore


Expect More Casualties

Smart phones, tablets, and their digital ecosystems have had a stunning impact on a range of industries in just a few short years. Those platforms changed how we work, how we shop, and how we interact with each other. And their disruption of traditional product companies has only just begun.

The first casualties were the entrenched smart phone vendors themselves, as IOS and Android devices and their platforms rose to prominence. It is remarkable that BlackBerry, which owned half of the US smart phone industry at the start of 2009, saw its share collapse to barely 10% by the end of 2010 and to less than 1% in 2014, even as it responded with comparable devices. It’s proving nearly impossible for BlackBerry to re-establish its foothold in a market where your ‘platform’, including your OS software and its features, the number of apps in your store, the additional cloud services, and the momentum in your user or social community are as important as the device.

A bit further afield is the movie rental business. Unable to compete with electronic delivery to a range of consumer devices, Blockbuster filed for bankruptcy protection in September 2010 just 6 years after its market peak. Over in another content business, Borders, the slowest of the big bookstore chains, filed for bankruptcy shortly after, while the other big bookstore chain, Barnes & Noble, has hung on with its Nook tablet and better store execution — a “partial” platform play. But the likes of Apple, Google, and Amazon have already won this race, with their vibrant communities, rich content channels , value-added transactions (Geniuses and automated recommendations), and constantly evolving software and devices. Liberty Mutual recently voted on the likely outcome of this industry with its disinvestment from Barnes & Noble.

What’s common to these early casualties? They failed to anticipate and respond to fundamental business model shifts brought on by advances in mobile, cloud computing, application portfolios and social communities. Combined, these technologies have evolved to lethal platforms that can completely overwhelm established markets and industries.  They failed to recognize that their new competitors were operating on a far more comprehensive level than their traditional product competitors. Competing on product versus platform is like a catapult going up against a precision-guided missile.

Sony provides another excellent example of a superior product company (remember the Walkman?) getting mauled by platform companies. Or consider the camera industry: IDC predicts that shipments of what it calls “interchangeable-lens cameras” or high end digital cameras peaked in 2012 and will decline 9.1% this year compared with last year  as the likes of Apple, HTC, Microsoft, and Samsung build high-quality cameras into their mobile devices. By some estimates, the high-end camera market in 2017 will be half what it was in 2012 as those product companies try to compete against the platform juggernauts.

The casualties will spread throughout other industries, from environmental controls to security systems to appliances. Market leadership will go to those players using Android or iOS as the primary control platform.

Over in the gaming world, while the producers of content (Call of Duty, Assassin’s Creed, Madden NFLC, etc.) are doing well, the console makers are having a tougher time. The market has already forever split  into games on mobile devices and those for specialized consoles, making the market much more turbulent for the console makers. Wii console maker Nintendo, for example, is expected to report a loss this fiscal year. If not for some dedicated content (e.g., Mario), the game might already be over for the company. In contrast, however, Sony’s PS4 and Microsoft’s Xbox One had successful launches in late 2013, with improved sales and community growth bolstering both “partial” platforms for the long term.

In fact, the retail marketplace for all manner of goods and services is changing to where almost all transactions start with the mobile device, leaving little room for traditional stores that can’t compete on price. Those stores must either add physical value (touch and feel, in-person expertise), experience (malls with ice skating rinks, climbing walls, aquariums), or exclusivity/service (Nordstrom’s) to thrive.

It is difficult for successful product companies to move in the platform direction, even as they start to see the platforms eating their lunch. Even for technology companies, this recognition is difficult. Only earlier this year did Microsoft drop the license fee for its ‘small screen’  operating systems. After several years, Microsoft finally realized that it can’t win against a mobile platform behemoths that give away their OS while it charges steep licensing fees for its mobile platform.

It will be interesting to see if Microsoft’s hugely successful Office product suite can compete over the long term with a slew of competing ecosystem plays. By extending Office to the iPad, Microsoft may be able to graft onto that platform and maintain its strong performance. While it’s still early to predict who will ultimately win that battle, I can only reference the battle of consumer iPhone and Android versus corporate BlackBerry — and we all know who won that one.

Over the next few years, expect more battles and casualties in a range of industries, as players leveraging Android, iOS, and other cloud/community platforms take on entrenched companies. Even icons such as Sony and Microsoft are at risk, should they cling to traditional product strategies.

Meantime, the likes of Google, Apple, Amazon, and Facebook are investing in future platforms — for homes, smart cars, robotics and drones, etc. As the ongoing impacts from the smart phone platforms continue, new platforms will add further impacts, so expect more casualties among traditional product companies, even seemingly in unrelated industries. 

This post first appeared in InformationWeek in February. It has been updated. Let me know your thoughts about platform futures. Best, Jim Ditmore.

Overcoming the Inefficient Technology Marketplace

The typical IT shop spends 60% or more of its budget on external vendors – buying hardware, software, and services. Globally, the $2 trillion dollar IT marketplace (2013 estimate by Forrester) is quite inefficient where prices and discounts vary widely between purchasers and often not for reasons of volume or relationship. As a result, many IT organizations fail to effectively optimize their spend, often overpaying by 10%, 20%, or even much more.

Considering that IT budgets continue to be very tight, overspending your external vendor budget by 20% (or a total budget overrun of 12%) means that you must reduce the remaining 40% budget spend (which is primarily for staff) by almost 1/3 ! What better way to get more productivity and results from your IT team than to spend only what is needed for external vendors and plow these savings back into IT staff and investments or to the corporate bottom line?

IT expenditures are easily one of the most inefficient areas of corporate spending due to opaque product prices and uneven vendor discounts. The inefficiency occurs across the entire spectrum of technology purchases – not just highly complex software purchases or service procurements. I learned from my experience in several large IT shops  that there is rarely a clear rationale for the pricing achieved by different firms other than they received what they competitively arranged and negotiated. To overcome this inefficient marketplace, the key prerequisite is to set up strong competitive playing fields for your purchases. With competitive tension, your negotiations will be much stronger, and your vendors will work to provide the best value. In several instances, when comparing prices and discounts between firms where I have worked that subsequently merged, it became clear that many IT vendors had no consistent pricing structures, and in too many cases, the firm that had greater volume had a worse discount rate than the smaller volume firm. The primary difference? The firm that robustly, competitively arranged and negotiated always had the better discount. The firms that based their purchases on relationships or that had embedded technologies limiting their choices typically ended up with technology pricing that was well over optimum market rates.

As an IT leader, to recapture the 6 to 12% of your total budget due to vendor overspend, you need to address inadequate technology acquisition knowledge and processes in your firm — particularly with your senior managers and engineers who are participating or making the purchase decisions. To achieve best practice in this area, the basics of a strong technology acquisition approach are covered here, and I will post on the reference pages the relevant templates that IT leaders can use to seed their own best practice acquisition processes. The acquisition processes will only work if you are committed to creating and maintaining competitive playing fields and not making decisions based on relationships. As a leader, you will need to set the tone with a value culture and focus on your company’s return on value and objectives – not the vendors’.

Of course, the technology acquisition process outlined here is a subset of the procurement lifecycle applied to technology. The technology acquisition process provides additional details on how to apply the lifecycle to technology purchases, leveraging the teams, and accommodating the complexities of the technology world. As outlined in the lifecycle, technology acquisition should then be complemented by a vendor management approach that repairs or sustains vendor performance and quality levels – this I will cover in a later post.

Before we dive into the steps of the technology acquisition process, what are the fundamentals that must be in place for it to work well? First, a robust ‘value’ culture must be in place. A ‘value’ culture is where IT management (at all levels) is committed to optimizing its company’s spending in order to make sure that the company gets the most for its money. It should be part of the core values of the group (and even better — a derivative of corporate values). The IT management and senior engineers should understand that delivering strong value requires constructing competitive playing fields for their primary areas of spending. If IT leadership instead allows relationships to drive acquisitions, then this quickly robs the organization of negotiating leverage, and cost increases will quickly seep into acquisitions.  IT vendors will rapidly adapt to how the IT team select purchases — if it is relationship oriented, they will have lots of marketing events, and they will try to monopolize the decision makers’ time. If they must be competitive and deliver outstanding results, they will instead focus on getting things done, and they will try to demonstrate value. For your company, one barometer on how you are conduct your purchases is the type of treatment you receive from your vendors. Commit to break out of the mold of most IT shops by changing the cycle of relationship purchases and locked-in technologies with a ‘value’ culture and competitive playing fields.

Second, your procurement team should have thoughtful category strategies for each key area of IT spending (e.g. storage, networking equipment, telecommunications services). Generally, your best acquisition strategy for a category should be to establish 2 or 3 strong competitors in a supply sector such as storage hardware. Because you will have leveled most of the technical hurdles that prevent substitution, then your next significant acquisition could easily go to any of vendors . In such a situation, you can drive all vendors to compete strongly to lower their pricing to win. Of course, such a strong negotiating position is not always possible due to your legacy systems, new investments, or limited actual competitors. For these situations, the procurement team should seek to understand what the best pricing is on the market, what are the critical factors the vendor seeks (e.g., market share, long term commitment, marketing publicity, end of quarter revenue?) and then the team should use these to trade for more value for their company (e.g., price reductions, better service, long term lower cost, etc). This work should be done upfront and well before a transaction initiates so that the conditions favoring the customer in negotiations are in place.

Third, your technology decision makers and your procurement team should be on the same page with a technology acquisition process (TAP). Your technology leads who are making purchase decisions should be work arm in arm with the procurement team in each step of the TAP.  Below is a diagram outlining the steps of the technology acquisition process (TAP). A team can do very well simply by executing each of the steps as outlined. Even better results are achieved by understanding the nuances of negotiations, maintaining competitive tension, and driving value.


Here are further details on each TAP step:

A. Identify Need – Your source for new purchasing can come from the business or from IT. Generally, you would start at this step only if it is a new product or significant upgrade or if you are looking to introduce a new vendor (or vendors) to a demand area. The need should be well documented in business terms and you should avoid specifying the need in terms of a product — otherwise, you have just directed the purchase to a specific product and vendor and you will very likely overpay.

B. Define Requirements – Specify your needs and ensure they mesh within the overall technology roadmap that the architects have defined. Look to bundle or gather up needs so that you can attain greater volumes in one acquisition to possibly gain better better pricing. Avoid specifying requirements in terms of products to prevent ‘directing’ the purchase to a particular vendor. Try to gather requirements in a rapid process (some ideas here) and avoid stretching this task out. If necessary, subsequent steps (including an RFI) can be used to refine requirements.

C. Analyze Options – Utilize industry research and high level alternatives analysis to down-select to the appropriate vendor/product pool. Ensure you maintain a strong competitive field. At the same time, do not waste time or resources for options that are unlikely.

D, E, F, G. Execute these four steps in concurrence. First, ensure the options will all meet critical governance requirements (risk, legal, security, architectural) and then drive the procurement selection process as appropriate based on the category strategy. As you narrow or extend options, conduct appropriate financial analysis. If you do wish to leverage proofs of concept or other trials, ensure you have pricing well-established before the trial. Otherwise, you will have far less leverage in vendor negotiations after it has been successful.

H. Create the contract – Leverage robust terms and conditions via well-thought out contract templates to minimize the work and ensure higher quality contracts. At the same time, don’t forgo the business objectives of price and quality and capability and trade these away for some unlikely liability term. The contract should be robust and fair with highly competitive pricing.

I. Acquire the Product – This is the final step of the procurement transaction and it should be as accurate and automated as possible. Ensure proper receivables and sign off as well as prompt payment. Often a further 1% discount can be achieved with prompt payment.

J & K. The steps move into lifecycle work to maintain good vendor performance and manage the assets. Vendor management will be covered in a subsequent post and it is an important activity that corrects or sustains vendor performance to high levels.

By following this process and ensuring your key decision makers set a competitive landscape and hold your vendors to high standards, you should be able to achieve better quality, better services, and significant cost savings. You can then plow these savings back into either strategic investment including more staff or reduce IT cost for your company. And at these levels, that can make a big difference.

What are some of your experiences with technology acquisition and suppliers? How have you tackled or optimized the IT marketplace to get the best deals?

I look forward to hearing your views. Best, Jim Ditmore

Moving from Offshoring to Global Service Centers II

As we covered in our first post on this topic, since the mid-90s, companies have used offshoring to achieve cost and capacity advantages in IT. Offshoring was a favored option to address Y2K issues and has continued to expand at a steady rate throughout the past twenty years. But many companies still approach offshoring as  ‘out-tasking’ and fail to leverage the many advantages of a truly global and high performance work force.

With out-tasking, companies take a limited set of functions or ‘tasks’ and move these to the offshore team. They often achieve initial economic advantage through labor arbitrage and perhaps some improvement in quality as the tasks are documented and  standardized in order to make it easier to transition the work to the new location. This constitutes the first level of a global team: offshore service provider. But larger benefits around are often lost and only select organizations have matured the model to its highest performance level as ‘global service centers’.

So, how do you achieve high performance global service centers instead of suboptimal offshore service providers? As discussed previously, you must establish the right ‘global footprint’ for your organization. Here we will cover the second half of getting to global service centers:  implementing a ‘global team’ model. Combined with the right footprint, you will be able to achieve global service centers and enable competitive advantage.

Global team elements include:

  • consistent global goals and vision across global sites with commensurate rewards and recognition by site
  • a matrix team structure that enables both integrated processes and local and global leadership and controls
  • clarity on roles based on functional responsibility and strategic competence rather than geographic location
  • the opportunity for growth globally from a junior position to a senior leader
  • close partnership with local universities and key suppliers at each strategic location

To understand the variation in performance for the different structures, first consider the effectiveness of your entire team – across the globe – on several dimensions:

  • level of competence (skill, experience)
  • productivity, ability to improve current work
  • ownership and engagement
  • customization and innovation contributions
  • source of future leaders

For an offshore service provider, where work has been out-tasked to a particular site, the team can provide similar or in some cases, better levels of competence. Because of the lower cost in the offshore location, if there is adequate skilled labour, the offshore service provider can more easily acquire such skill and experience within a given budget. A recognizable global brand helps with this talent acquisition. But since only tasks are sent to the center, productivity and continuous improvement can only be applied to the portions of the process within the center. Requirements, design, and other early stage activities are often left primarily to the ‘home office’ with little ability for the offshore center to influence. Further, the process standards and ownership typically remain at home office as well, even though most implementation may be done at the offshore service provider. This creates a further gap where implications of new standards or home office process ‘improvements’ must be borne by the offshore service provider even if the theory does not work well in actual practice. And since implementation and customer interfaces are often limited as well, the offshore service provider receives little real feedback, furthering constraining the improvement cycle.

For the offshore service provider,  the ability to improve processes and productivity is limited to local optimization only, and capabilities are often at the whims of poor decisions from a distant home office. More comprehensive productivity and process improvements can be achieved by devolving competency authority to the primary team executing the work. So, if most testing is done in India, then the testing process ownership and testing best practices responsibility should reside in India. By shifting process ownership closer to the primary team, there will be a natural interchange and flow of ideas and feedback that will result in better improvements, better ownership of the process, and better results. The process can and should still be consistent globally, the primary competency ownership just resides at its primary practice location.  This will result in a highly competent team striving to be among the best in the world. Even better, the best test administrators can now aspire to become test best practice experts and see a longer career path at the offshore location. Their productivity and knowledge levels will improve significantly. These improvements will reduce attrition and increase employee engagement in the test team, not just in India but globally. In essence, by moving from proper task placement to proper competency placement, you enable both the offshore site and the home sites to perform better on both team skill and experience, as well as team productivity and process improvement.

Proper competency placement begins the movement of your sites from offshore service providers to global service excellence. Couple competency placement with transparent reporting on the key metrics for the selected competencies (e.g., all test teams, across the globe, should report based on best in class operational metrics) and drive improvement cycles (local and global) based on findings from the metrics. Full execution of these three adjustments will enable you to achieve sustained productivity improvements of 10 to 30% and lower attrition rates (of your best staff) by  20 to 40%.

It is important to understand that pairing competency leadership with primary execution is required in IT disciplines much more so than other fields due to the rapid fluidity and advance of technology practices, the frequent need to engage multiple levels of the same expertise to resource and complete projects, and the ambiguity and lack of clear industry standards in many IT engineering areas. In many other industries (manufacturing, chemicals, petroleum), stratification between engineering design and implementation is far more rigorous and possible given the standardization of roles and slower pace of change. Thus, organizations can operate far closer to optimum even with task offshoring that is just not possible in the IT space over any sustained time frame.

To move beyond global competency excellence, the structures around functions (the entire processes, teams and leadership that deliver a service) must be optimized and aligned. First and foremost, goals and agenda must be set consistently across the globe for all sites. There can be no sub agendas where offshore sites focus only on meeting there SLAs or capturing a profit, instead the goals must be the appropriate IT goals globally. (Obviously, for tax implications, certain revenue and profit overheads will be achieved but that is an administrative process not an IT goal. )

Functional optimization is achieved by integrating the functional management across the globe where it becomes the primary management structure. Site and resource leadership is secondary to the functional management structure. It is important to maintain such site leadership to meet regulatory and corporate requirements as well as provide local guidance, but the goals, plans, initiatives, and even day-to-day activities flow through a natural functional leadership structure. There is of course a matrix management approach where often the direct line for reporting and legal purposes is the site management, but the core work is directed via the functional leadership. Most large international companies have mastered this matrix management approach and staff and management understand how to properly work within such a setup.

It is worth noting that within any large services corporation ‘functional’ management will reign supreme over ‘site’ management. For example, in a debate deciding what are the critical projects to be tackled by the IT development team, it is the functional leaders working closely with the global business units that will define the priorities and make the decisions. And if the organization has a site-led offshore development shop, they will find out about the resources required long after the decisions are made (and be required to simply fulfill the task). Site management is simply viewed as not having worthy knowledge or authority to participate in any major debate. Thus if you have you offshore centers singularly aligned to site leadership all the way up the corporate chain, the ability to influence or participate in corporate decisions is minimal. However, if you have matrixed the structure to include a primary functional reporting mechanism, then the offshore team will have some level of representation. This increases particularly as manager and senior managers populate the offshore site and are enable functional control back into home offices or other sites. Thus the testing team, as discussed earlier, if it is primarily located in India, would have not just responsibility for the competency and process direction and goals but also would have the global test senior leader at its site who would have test teams back at the home office and other sites. This structure enables functional guidance and leadership from a position of strength. Now, priorities, goals, initiatives, functional direction can flow smoothly from around the globe to best inform the functional direction. Staff in offshore locations now feel committed to the function resulting in far more energy and innovation arising from these sites. The corporation now benefits from having a much broader pool of strong candidates for leadership positions. And not just more diverse candidates, but candidates who understand a global operating model and comfortable reaching across time zones and cultures. Just what is needed to compete globally in the business. The chart below represents this transition from task to competency to function optimization.

Global Team ProgressionIf you combine the functional optimization with a highly competitive site structure, you can typically organize key function in 2 or 3 locations where global functional leadership will reside. This then adds time of day and business continuity advantages. By having the same function at a minimum of two sites, then even if one site is down the other can operate. Or IT work can be started at one site and handed off at the end of the day at the next site that is just beginning their day (in fact most world class IT command centers operate this way). Thus no one ever works the night shift. And time to market can be greatly improved by leveraging such time advantages.

While it is understandably complex that you are optimizing across many variables (site location, contractor and skill mix, location cost, functional placement, competency placement, talent and skill availability), IT teams that can achieve a global team model and put in place global service centers reap substantial benefits in cost, quality, innovation, and time to market.

To properly weigh these factors I recommend a workforce plan approach where each each function or sub function maps out their staff and leaders across site, contractor/staff mix, and seniority mix. Lay out the target to optimize across all key variables (cost, capability, quality, business continuity and so on) and then construct a quarterly trajectory of the function composition from current state until it can achieve the target. Balance for critical mass, leadership, and likely talent sources. Now you have the draft plan of what moves and transactions must be made to meet your target. Every staff transaction (hires, rotations, training, layoffs, etc) going forward should be weighed against whether it meshes with the workforce plan trajectory or not. Substantial progress to an optimized global team can then be made by leveraging a rising tide of accumulated transactions executed in a strategic manner. These plans must be accompanied or even introduced by an overall vision of the global team and reinforcement of the goals and principles required to enable such an operating model. But once laid, you and your organization can expect to achieve far better capabilities and results than just dispersing tasks and activities around the world.

In today’s global competition, this global team approach is absolutely key for competitive advantage and essential for competitive parity if you are or aspire to be a top international company. It would be great to hear of your perspectives and any feedback on how you or your company been either successful (or unsuccessful) at achieving a global team.

I will add a subsequent reference page with Workforce Plan templates that can be leveraged by teams wishing to start this journey.

Best, Jim Ditmore

Moving from Offshoring to Global Shared Service Centers

My apologies for the delay in my post. It has been a busy few months and it has taken an extended time since there is quite a bit I wish to cover in the global shared service center model. Since my NCAA bracket has completely tanked, I am out of excuses to not complete the writing, so here is the first post with at least one to follow. 

Since the mid-90s, companies have used offshoring to achieve cost and capacity advantages in IT. Offshoring was a favored option to address Y2K issues and has continued to expand at a steady rate throughout the past twenty years. But many companies still approach offshoring as  ‘out-tasking’ and fail to leverage the many advantages of a truly global and high performance work force.

With out-tasking, companies take a limited set of functions or ‘tasks’ and move these to the offshore team. They often achieve initial economic advantage through labor arbitrage and perhaps some improvement in quality as the tasks are documented and  standardized in order to make it easier to transition the work to the new location. This constitutes the first level of a global team: offshore service provider. But larger benefits around are often lost and typically include:

  • further ongoing process improvement,
  • better time to market,
  • wider service times or ‘follow the sun’,
  • and leverage of critical innovation or leadership capabilities of the offshore team.

In fact, the work often stagnates at whatever state it was in when it was transitioned with little impetus for further improvement. And because lower level tasks are often the work that is shifted offshore and higher level design work remains in the home country, key decisions on design or direction can often take an extended period – actually lengthening time to market. In fact, design or direction decisions often become arbitrary or disconnected because the groups – one in home office, the other in the offshore location – retain significant divides (time of day, perspective, knowledge of the work, understanding of the corporate strategy, etc). At its extreme, the home office becomes the ivory tower and the offshore teams become serf task executors and administrators. Ownership, engagement, initiative and improvement energies are usually lost in these arrangements. And it can be further exacerbated by having contractors at the offshore location, who have a commercial interest in maintaining the status quo (and thus revenue) and who are viewed as with less regard by the home country staff. Any changes required are used to increase contractor revenues and margins. These shortcomings erase many of the economic advantages of offshoring over time and further impact the competitiveness of the company in areas such as agility, quality, and leadership development.

A far better way to approach your workforce is to leverage a ‘global footprint and a global team’. And this approach is absolutely key for competitive advantage and essential for competitive parity if you are an international company. There are multiple elements of the ‘global footprint and team’ approach, that when effectively orchestrated by IT leadership, can achieve far better results than any other structure. By leveraging high performance global approach, you can move from an offshore service provider to a shared service excellence center and, ultimately to a global service leadership center.

The key elements of a global team approach can be grouped into two areas: high performance global footprint and high performance team. The global footprint elements are:

  • well-selected strategic sites, each with adequate critical mass, strong labor pools and higher education sources
  • proper positioning to meet time-of-day and improved skill and cost mix
  • knowledge and leverage of distinct regional advantages to obtain better customer interface, diverse inputs and designs, or unique skills
  • proper consolidation and segmentation of functions across sites to achieve optimum cost and capability mixes

Global team elements include:

  • consistent global goals and vision across global sites with commensurate rewards and recognition by site
  • a team structure that enables both integrated processes and local and global controls
  • the opportunity for growth globally from a junior position to a senior leader
  • close partnership with local universities and key suppliers at each strategic location
  • opportunity for leadership at all locations

Let’s tackle global footprint today and in a follow on post I will cover global team. First and foremost is selecting the right sites for your company. Your current staff total size and locations will obviously factor heavily into your ultimate site mix. Assess your current sites using the following criteria:

  • Do they have critical mass (typically at least 300 engineers or operations personnel, preferably 500+) that will make the site efficient, productive and enable staff growth?
  • Is the site located where IT talent can be easily sourced? Are there good universities nearby to partner with? Is there a reasonable Are there business units co-located or customers nearby?
  • Is the site in a low, medium, or high cost location?
  • What is the shift (time zone) of the location?

Once you have classified your current sites with these criteria, you can then assess the gaps. Do you have sites in low-cost locations with strong engineering talent (e.g. India, Eastern Europe)? Do you have medium cost locations (e.g., Ireland or 2nd tier cities in the US midwest)? Do you have too many small sites (e.g., under 100 personnel)? Do you have sites close to key business units or customers? Are no sites located in 3rd shift zones? Remember that your sites are more about the cities they are located in than the countries. A second tier city in India or a first or second tier city in Eastern Europe can often be your best site location because of improved talent acquisition and lower attrition than 1st tier locations in your country or in India.

It is often best to locate your service center where there are strong engineering and business universities nearby that will provide an influx of entry level staff eager to learn and develop. Given staff will be the primary cost factor in your service, ensure you locate in lower cost areas that have good language skills, access to the engineering universities, and appropriate time zones. For example, if you are in Europe, you should look to have one or two consolidated sites located just outside 2nd tier cities with strong universities. For example, do not locate in Paris or London, instead base your service desk either in or just outside Manchester or Budapest or Vilnius. This will enable you to tap into a lower cost yet high quality labor market that also is likely to provide more part-time workers that will help you solve peak call periods. You can use a similar approach in the US or Asia.

A highly competitive site structure enables you to meet a global optimal cost and capability mix as well. At the most mature global teams in very large companies, we drove for a 20/40/40 cost mix (20% high cost, 40% medium and 40% low cost) where each site is in a strong engineering location. Where possible, we also co-located with key business units. Drive to the optimal mix by selecting 3, 4, or 5 strategic sites that meet the mix target and that will also give you the greatest spread of shift coverage.  Once you have located your sites correctly, you must then of course drive to have effective recruiting, training, and management of the site to achieve outstanding service. Remember also that you must properly consolidate functions to these strategic sites.  Your key functions must be consolidated to 2 or 3 of the sites – you cannot run a successful function where there are multiple small units scattered around your corporate footprint. You will be unable to invest in the needed technology and provide an adequate career path to attract the right staff if it is highly dispersed.

You can easily construct a matrix and assess your current sites against these criteria. Remember these sites are likely the most important investments your company will make. If you have poor portfolio of sites, with inadequate labor resources or effective talent pipelines or other issues, it will impact your company’s ability to attract and retain it’s most important asset to achieve competitive success. It may take substantial investment and an extended period of time, but achieving an optimal global site and global team will provide lasting competitive advantage.

I will cover the global team aspects in my next post along with the key factors in moving from a offshore service provider to shared service excellence to shared service leadership.

It would be great to hear of your perspectives and any feedback on how you or your company been either successful (or unsuccessful) at achieving a global team.

Best, Jim Ditmore

Keeping Score and What’s In Store for 2014

Now that 2013 is done, it is time to review my predictions from January last year. For those keeping score, I had six January predictions for Technology in 2013:

6. 2013 is the year of the ‘connected house’ as standards and ‘hub’ products achieve critical mass. Score: Yes! – A half dozen hubs were introduced in 2013 including Lowe’s and AT&T’s as well as SmartThings and Nest. The sector is taking off but is not quite mainstream as there is a bit of administration and tinkering to get everything hooked in. Early market share could determine the standards and the winners here.

5. The IT job market will continue to tighten requiring companies to invest in growing talent as well as higher IT compensation. Score: Nope! – Surprisingly, while the overall job market declined from a 7.9% unemployment rate to 7.0% over 2013, the tech sector had a slight uptick from 3.3% to 3.9% in the 3rd quarter (4Q numbers not available). However, this uptick seems to be caused by more tech workers switching jobs (and thus quitting old jobs) perhaps due to more confidence and better pay elsewhere. Look for a continued tight supply of IT workers as the Labor department predicts that by 2020, another 1.4M IT workers are required and there will only be 400K IT graduates during that time!

4. Fragmentation will multiply in the mobile market, leaving significant advantage to Apple and Samsung being the only companies commanding premiums for their products. Score: Yes and no – Fragmentation did occur in Android segment, but the overall market consolidated greatly. And Samsung and Apple continued in 2013 to capture the lion’s share of all profits from mobile and smart phones. Android picked up market share (and fragment into more players), as well as Windows Phone, notably in Europe. Apple dipped some, but the greatest drop was in ‘other’ devices (Symbian, Blackberry, etc). So expect a 2014 market dominated by Android, iOS, and a distant third to Windows Phone. And Apple will be hard pressed to come out with lower cost volume phones to encourage entry into their ecosystem. Windows Phone will need to continue to increase well beyond current levels especially in the US or China in order to truly compete.

3. HP will suffer further distress in the PC market both from tablet cannibalization and aggressive performance from Lenovo and Dell. Score: Yes! – Starting with the 2nd quarter of 2013, Lenovo overtook HP as the worldwide leader in PC shipments and then widened it in the 3rd quarter. Dell continued to outperform the overall market sector and finished a respectable second in the US and third in the world. Overall PC shipments continued to slide with an 8% drop from 2012, in large part due to tablets. Windows 8 did not help shipments and there does not look like a major resurgence in the market in the near term. Interestingly, as with smart phones, there is a major consolidation occurring around the top 3 vendors in the market — again ‘other’ is the biggest loser of market share.

2. The corporate server market will continue to experience minimal increases in volume and flat or downward pressure on revenue. Score: Yes! – Server revenues declined year over year from 2012 to 2013 in the first three quarters (declines of 5.0%, 3.8%, and 2.1% respectively). Units shipped treaded water with a decline in the first quarter of .7%, an uptick in the second quarter of  4%, and a slight increase in the third quarter of 2%. I think 2014 will show more robust growth with greater business investment.

1. Microsoft will do a Coke Classic on Windows 8. Score: Yes and no – Windows 8.1 did put back the Start button, but retained much of the ‘Metro’ interface. Perhaps best cast as the ‘Great Compromise’, Windows 8.1 was a half step back to the ‘old’ interface and a half step forward to a better integrated user experience. We will see how the ‘one’ user experience across all devices works for Microsoft in 2014.

So, final score was 3 came true, 2 mostly came true, and 1 did not – for a total score of 4. Not too bad though I expected a 5 or 6 🙂 . I will do one re-check of the score when the end of year IT unemployment figures come out to see if the strengthening job market made up for the 3rd quarter dip.

As an IT manager, it is important to have strong, robust competition – it was good to see both Microsoft and HP come out swinging in 2013. Maybe they did not land many punches but it is good to have them back in the games.

Given it is the start of the year, I thought I would map out some of the topics I plan to cover this coming year in my posts. As you know, the focus of Recipe for IT  is useful best practice techniques and advice that works in the real world and enables IT managers to be more successful. In 2013, we had a very successful year with over 43,000 views from over 150 countries, (most are from the US, UK, India, and Canada). And I wish to thank the many who have contributed comments and feedback — it has really helped me craft a better product. So with that in mind, please provide your perspective on the upcoming topics, especially if there are areas you would like to see covered that are not.

For new readers, I have structured the site into two main areas: posts – which are short, timely essays on a particular topic and reference pages– which often take a post and provide a more structured and possibly deeper view of the topic. The pages are intended to be an ongoing reference of best practice for you leverage. You can reach the reference pages from the drop down links on the home page.

For posts, I will be continue the discussion on cloud and data centers. I will also explore flash storage and the continuing impact of mobile. Security will invariably be a topic. Some of you may have noticed some posts are placed first on InformationWeek and then subsequently here. This helps increase the exposure of Recipe for IT and also ensure good editing (!).

For the reference pages, I have recently refined and will continue to improve the production and quality areas. Look also for updates and improvements to leadership  as well as the service desk.

What other topics would you like to see explored? Please comment and provide your feedback and input.

Best, and I wish you a great start to 2014,

Jim Ditmore